I recently saw an article by Gary Taubes get posted to Hacker News. He pushes the curious thesis that conventional wisdom on obesity is somehow incorrect since it fails to explain why people choose not to put down the chips.
He begins with some straightforward calculations:
When you're in your late 20s, say, you're still lean, and then, lo and behold, you celebrate your fiftieth birthday and you're obese and your doctor is lecturing you on eating less and getting to the gym regularly (and probably writing you a prescription for Lipitor, as well). Now, if you gain 40 pounds of fat over 20 years, that's an average of two pounds of excess fat accumulation every year. Since a pound of fat is roughly equal to 3500 calories, this means you accumulate roughly 7000 calories worth of fat every year. Divide that 7000 by 365 and you get the number of calories of fat you stored each day and never burned – roughly 19 calories. Let's round up to 20 calories, so we have a nice round number. (In the new book I discuss this issue in a chapter called “The Significance of Twenty Calories a Day.”)
That's curious. It makes the difference between a healthy weight and obesity seem so small. Only 20 calories? Can modern medical science really be claiming this?
Of course, it's not that hard to miss the fact that this is 20 calories/day in excess of your maintenance needs. Hmm, I wonder what those are? Unfortunately, Taube's blog post doesn't say. Luckily, it isn't hard to find out.
So I decided to go make some graphs to figure out what the difference is between a man who maintains his weight between age 30 and 50, and another man who becomes obese. I assumed a 6' tall man who starts with an "ideal weight" of 165lb at age 30. The blue line of the graph shows this man's daily calorie consumption, assuming a light activity level and no weight gain. The green line indicates the calorie consumption of the gainer - that is, the person who gains 40lbs over 20 years. The red line indicates the maintenance needs of the gainer - this is the amount of calories the gainer needs to eat to hold his weight constant in that year. (Source code for the graph is included at the end.)
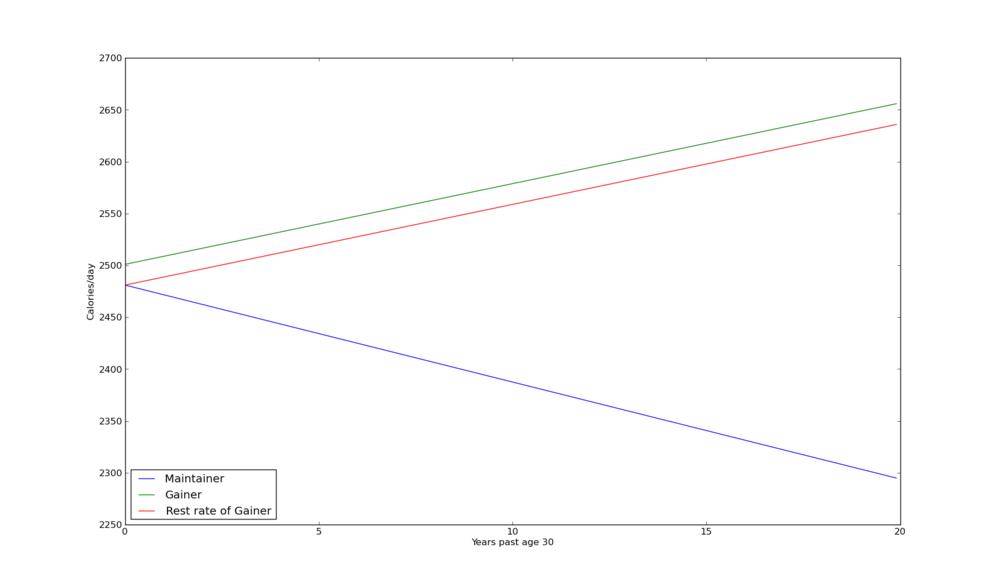
Interesting - it looks like after 20 years, the gap between the maintainer and the gainer is a little more than "a bite or two of food, a swallow or two of soda or fruit juice or milk or beer" (to borrow the language Gary Taubes uses). After 20 years, the gainer is actually eating 7 and a half strips of bacon more than the maintainer. If the gainer were to stop gaining in his 20'th year, he would instead be eating only 7 strips of bacon more than the maintainer.
I must admit, I'm a bit confused as to why Gary Taubes spends so much time focusing on that last half strip of bacon. Why not at least devote one paragraph (out of 21) to the excess 7 strips of bacon eaten by the gainer?
[edit: Just want to clarify that I'm not necessarily arguing against Taube's major thesis. Apart from "go buy my book", I can't even figure out what his major thesis is. I'm simply pointing out that he seems to be deliberately igoring 7 strips of bacon/day.]