In a recent blog post, Karl Smith defends U3 from it's critics. The majority of his defense is spot on - U3 is a consistent, well-understood measurement which we can use to measure changes over time, and we also have a pretty good understanding of it's relationship to other relevant quantities.
But I'll dispute him on one point - U3 by itself does not measure whether or not the labor market is clearing.
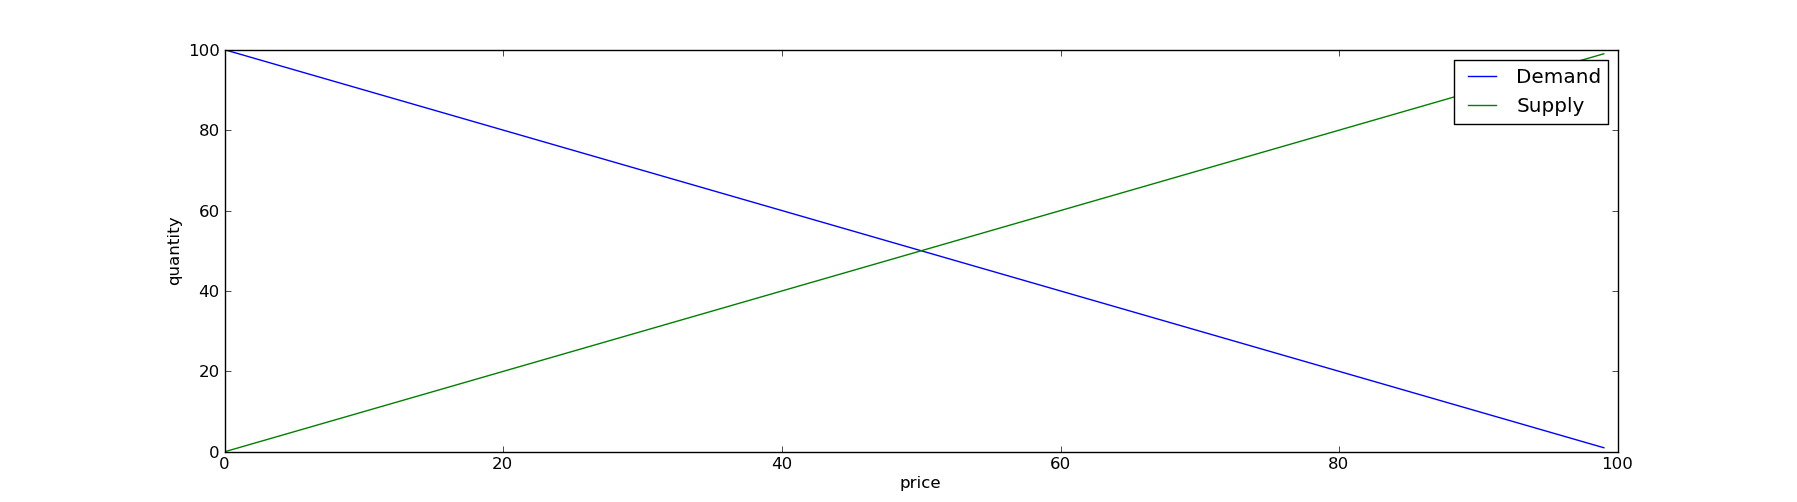
This can be demonstrated with a very simple example. Consider a market with supply curve s(p) and demand curve d(p). Let us also assume for simplicity that each buyer and seller wants to buy or sell precisely one unit (perhaps a single full time 40 hour week of labor). Each buyer and seller has a fixed reservation price - above or below this price, they will refuse to transact. In that case, s(p) as the number of sellers with reservation price at least as low as p and d(p) as the number of buyers with reservation price as high as p.
Now consider two scenarios, both of which involve a Walrasian Auction to clear the market for labor. Note that since each buyer and seller will transact for only a single unit of labor, submitting one's bit to the auctioneer is identical to telling the auctioneer one's reservation price.
For the sake of argument, I'm assuming that submitting one's reserve price to the auctioneer is counted by the BLS as "job seeking activity".
Scenario 1) In this scenario, every agent submits his or her reservation price to the auctioneer. The auctioneer then finds a market clearing price P for which s(P)=d(P) and sets the price at that level. The number of transactions which occur is s(P).
Thus, in this scenario, the number of sellers who have engaged in job seeking activity" is s(infinity) which is the entire population of potential sellers. If this is a labor market then unemployment rate is (s(infinity)-s(P))/s(infinity).
From the perspective of the auctioneer, the supply and demand curves are perceived as follows (with P=50 in the graph shown):
Scenario 2) In this alternate scenario, the agents already have a good idea of what a perfect Walrasian auctioneer might do. They have a rough estimate and believe that P lies somewhere in the interval a < P < b. Because job hunting is boring, and has a cost which is infinitesimally positive, sellers with a reservation price larger than b do not bother submitting their reserve price to the auctioneer.
The auctioneer perceives the supply and demand curves as follows:
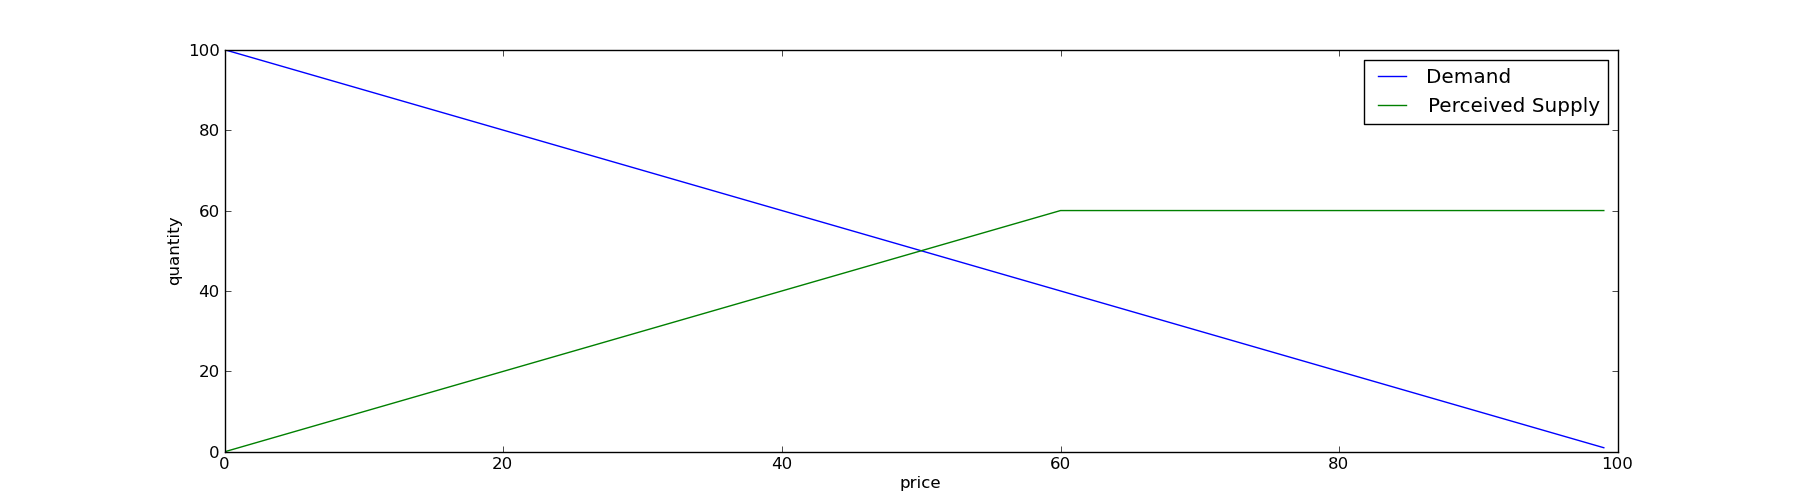
Thus, the auctioneer matches supply to demand at the exact same price P (50 in the graph, with b=60).
However, the measured unemployment rate in this labor market is (s(b)-s(P))/s(b). Due to the monotonicity of s(p), this measured unemployment rate is always less than or equal to the measured rate in scenario 1.
The market clears in both scenarios, but one of them has a higher U3 than the other. In the simple example I used in the graph, scenario 1 has an unemployment rate of 50% while scenario 2 has an unemployment rate of only 16.6%.
Now for practical purposes, I generally agree with Karl that higher than average U3 is correlated with non-classical behavior in the marketplace. But this requires considerably more justification than he has provided.